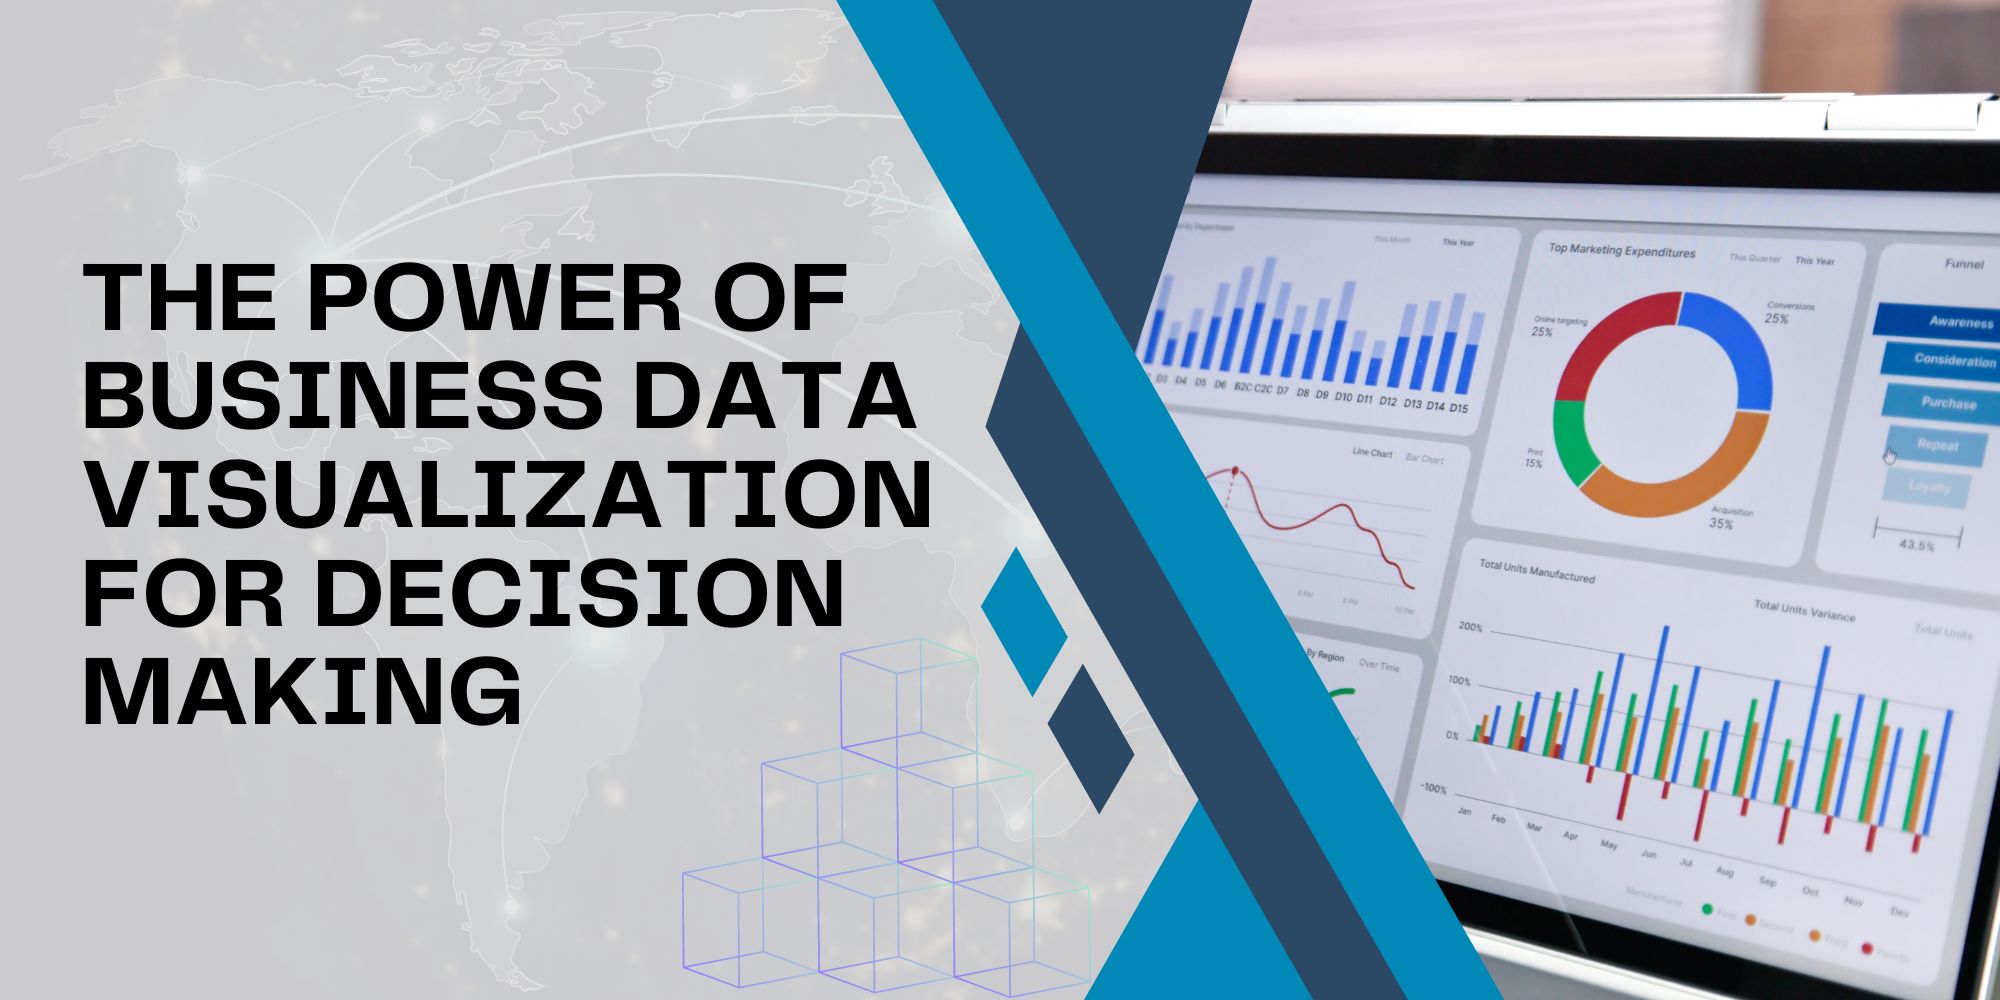
“In today’s fast-paced business world, data visualization is indispensable for converting complex data into actionable insights swiftly. It empowers decision-makers with faster comprehension, tailored information delivery, holistic insights, and the ability to identify critical trends. By leveraging visual tools, businesses enhance operational efficiency and strategic alignment, fostering a culture of data-driven decision-making for sustained growth and competitive advantage.”
Hi everyone! Grab your favorite drink, get cozy, and prepare to explore the transformative power of data visualization in business decision-making. Discover how clear visuals can revolutionize how we understand and act on complex data! If you’re in a hurry, skip to the bottom of this post for a quick summary.
In today’s fast-paced and data-centric business environment, the ability to make informed decisions swiftly is crucial for staying competitive. However, the sheer volume and complexity of data can overwhelm even the most seasoned executives and managers. This is where data visualization steps in—a transformative tool that converts intricate data into clear, actionable insights. Let’s delve into why data visualization is indispensable and how it empowers effective decision-making across various organizational functions.
1. Faster Comprehension
Human brains process visuals significantly faster than text—approximately 60,000 times faster. This cognitive advantage is pivotal in business contexts where time is of the essence. Imagine a scenario where executives need to grasp the performance metrics of different departments quickly. A well-designed chart or graph can convey trends and outliers more effectively than pages of textual data. This rapid understanding enables decision-makers to focus on strategic issues rather than getting lost in data interpretation.
2. Tailored Information Delivery
Just as a tailor crafts a suit to fit perfectly, data visualization can be tailored to meet the specific needs of various business functions—from supply chain management to financial forecasting. Each department requires distinct metrics and insights relevant to its operations. For instance, HR might benefit from visualizations that depict employee performance trends, while IT may need graphs showing system uptime and performance metrics. Customizing data presentations ensures that decision-makers receive information in a format that resonates with their expertise and responsibilities.
3. Holistic Insights
Visualization tools provide panoramic views of critical business information in real-time. Whether it’s monitoring Key Performance Indicators (KPIs), tracking market trends, or understanding customer behavior, clear and intuitive representations facilitate deeper insights. Decision-makers gain a comprehensive understanding of the interconnected factors influencing their business, enabling them to make proactive and informed decisions. This holistic approach prevents tunnel vision and fosters a more integrated strategy across the organization.
4. Identifying Trends and Patterns
Data visualization excels in uncovering hidden trends and patterns buried within vast datasets. While raw data can be dense and opaque, visual representations highlight correlations, outliers, and emerging trends with clarity. For example, a line graph depicting sales performance over time may reveal seasonal spikes or unexpected downturns that merit further investigation. By making these insights readily accessible, data visualization empowers decision-makers to anticipate market shifts, optimize resource allocation, and capitalize on emerging opportunities.
The power of data visualization lies in its ability to transform complex data into actionable insights swiftly and comprehensively. By leveraging visual tools, businesses can enhance decision-making processes across all levels—from strategic planning to day-to-day operations. Whether it’s speeding up comprehension, customizing information delivery, gaining holistic insights, or identifying critical trends, data visualization remains an indispensable asset in the modern business toolkit. Embracing this technology not only enhances operational efficiency but also fosters a culture of data-driven decision-making, driving sustained growth and competitive advantage in today’s dynamic market landscape.
Hope you enjoyed this post! While you’re here, and in a reading mood, why not check out a few of our other pieces? We have several blog posts on Salesforce CRM, AI, Salesforce CPQ, Zoho, and many other topics that we just know you’ll love. Browse the topics here.


