Running a business requires hands-on management and monitoring of every small step to avoid errors and predict possible risks. However, no business owner can reach out to every employee personally to check on the progress of their tasks and overall performance. So, how would one keep track of business performances, customer relationships, profits, employee performance, etc.? Well, Zoho Reports is a handy and clever solution.
What are Zoho Reports?
Zoho Reports can be defined as an online reporting business intelligence service that helps business owners and their employees automatically generate reports on business activities and analyze that data to make informed decisions. The reports are also customizable and are a very effective tool to interpret future business opportunities and avoid risk. The biggest advantage of Zoho Reports is that they are supported by artificial intelligence, ensuring error-free reporting and insightful data interpretations. Zoho Reports also offers your data visualization options in the form of charts and graphs.
There are three types of Zoho Reports:
Tabular Reports
You may list your data in rows and columns.
Summary Reports
The users can view data along with subtotals, groupings, etc.
Matric Reports
The summary report is laid out in grid format.
Types of Standard Zoho CRM Reports
Sales Reports
Sales reports allow you to analyze the performance of your sales executives and sales departments. The sales report will have the following data: details of deals closed each month, the stage and chances of conversion of contacts in the pipeline, and revenue earned on the particular month. This gives you an insight into your profit.
Marketing Reports
Marketing reports allow you to have a clear picture of how marketing campaigns are performing. They give you an insight into how many leads were attracted to your website, based on your marketing campaigns, and how many deals were closed, based on your Google AdWords campaign. Marketing reports are a great way to learn about customer interests and preferences. You may launch products and services that will sell because you will have a clear idea of what your audience likes.
Activity Reports
Activity reports allow you to have a clear understanding of business activities and workflow inside your organization. You will have clear data on employee performance, individual conversion rates by the sales team, customer support live chats answered, etc. Activity reports help you score your employees and encourage them with rewards to perform better and/or help struggling employees through training.
How To Generate A Report In Zoho CRM:
Select the Zoho Reports module.
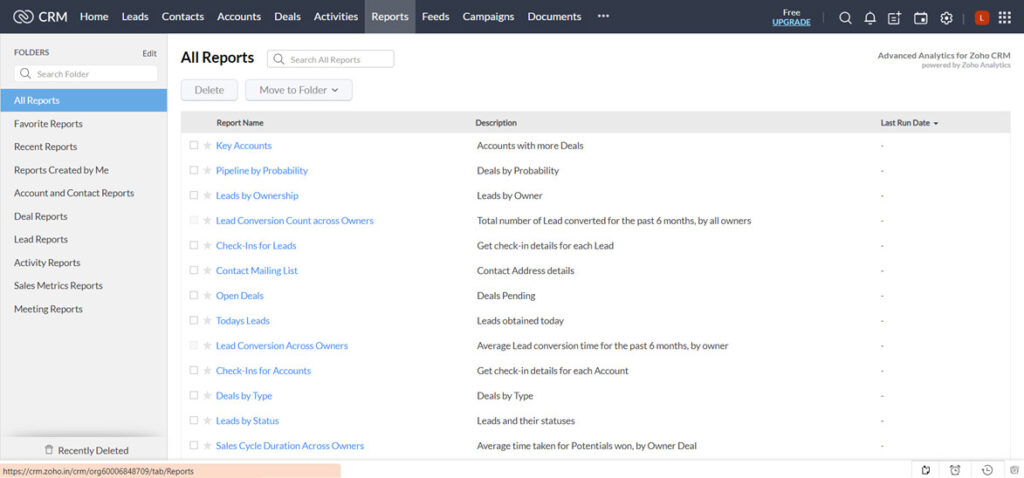
Now, Click on the Create Report button as shown below.
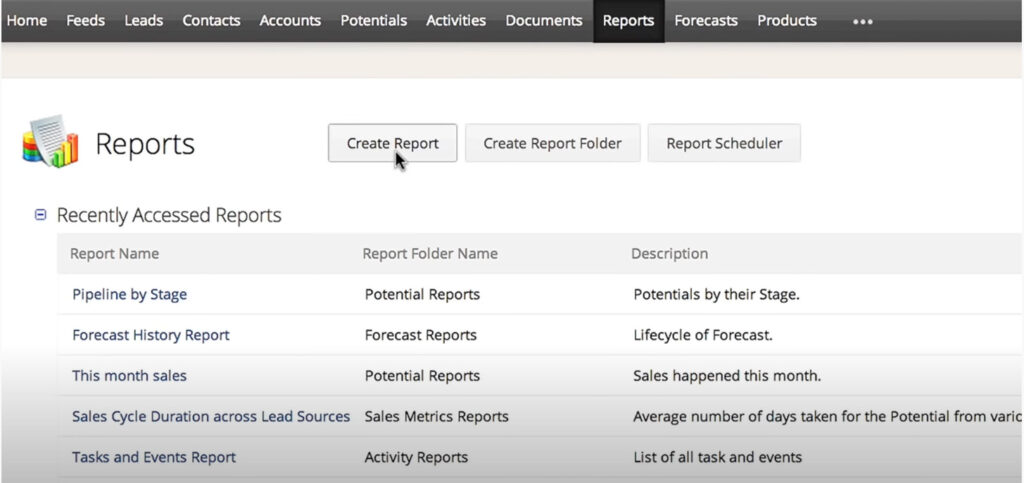
Once you press the Create Report Button, a window will appear as below:
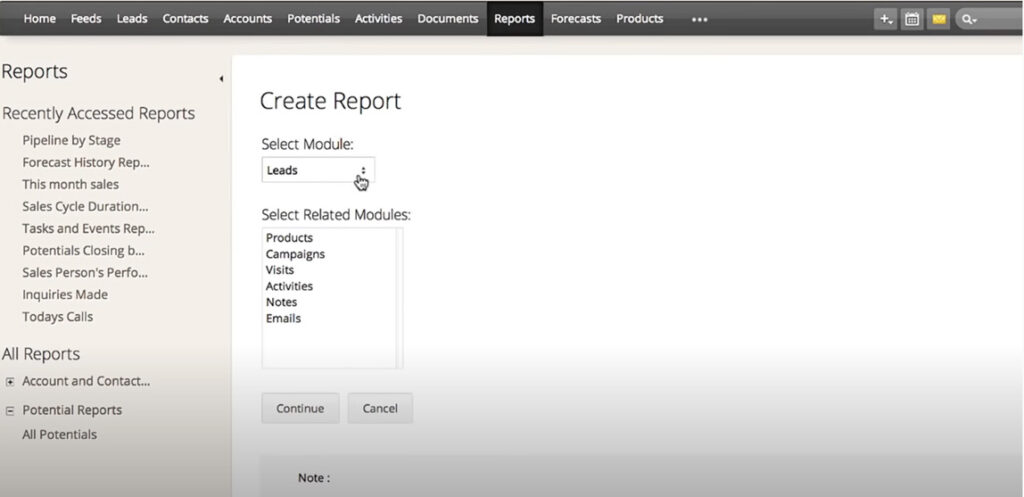
Here, you may select the main module for the main data and the related module for secondary data. For example, here we are selecting Potentials and Accounts, respectively, to create a report. Press Continue.
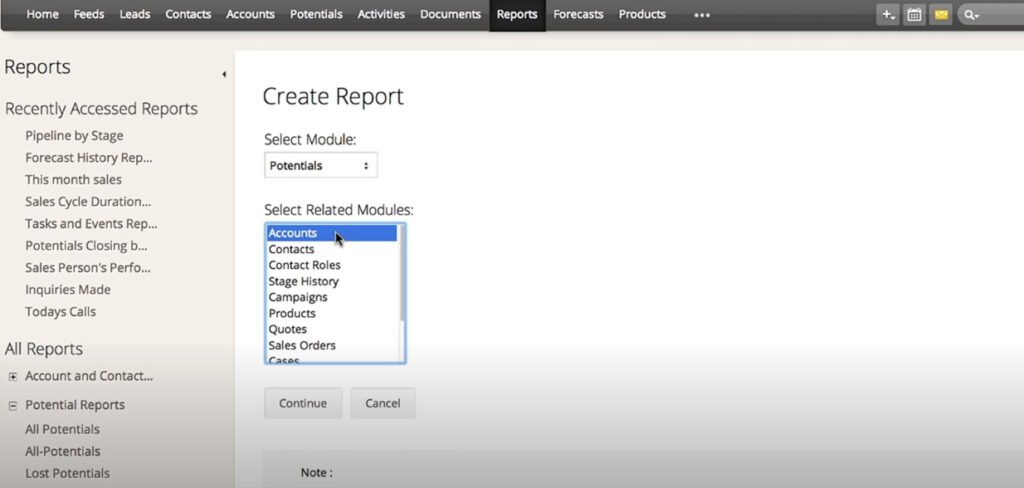
Now, you need to choose the type of report you want to generate as shown below:
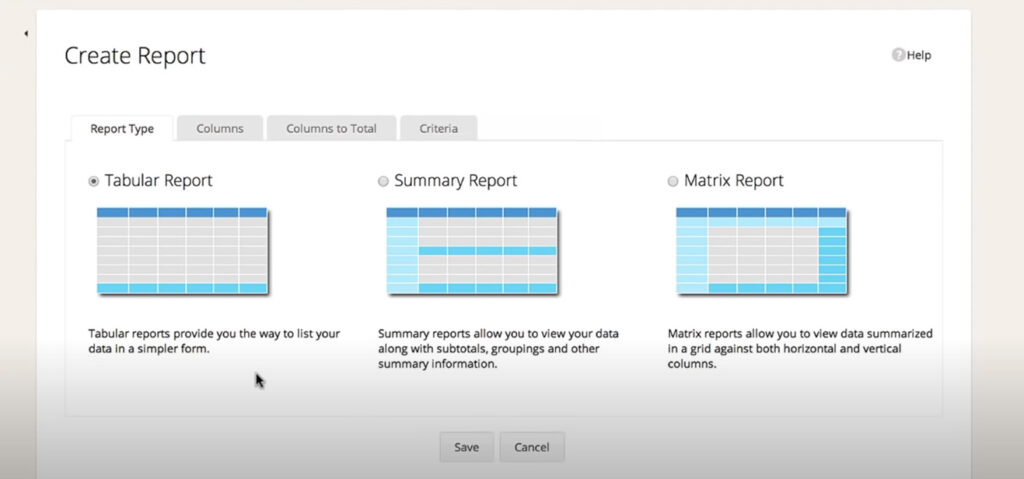
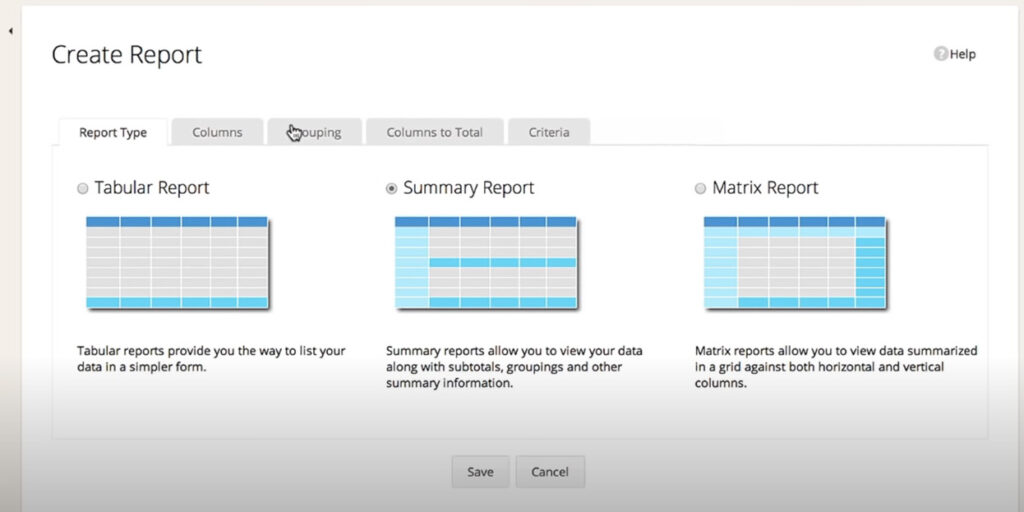
Now, select the report type of your choice. Here, we choose Summary Report.
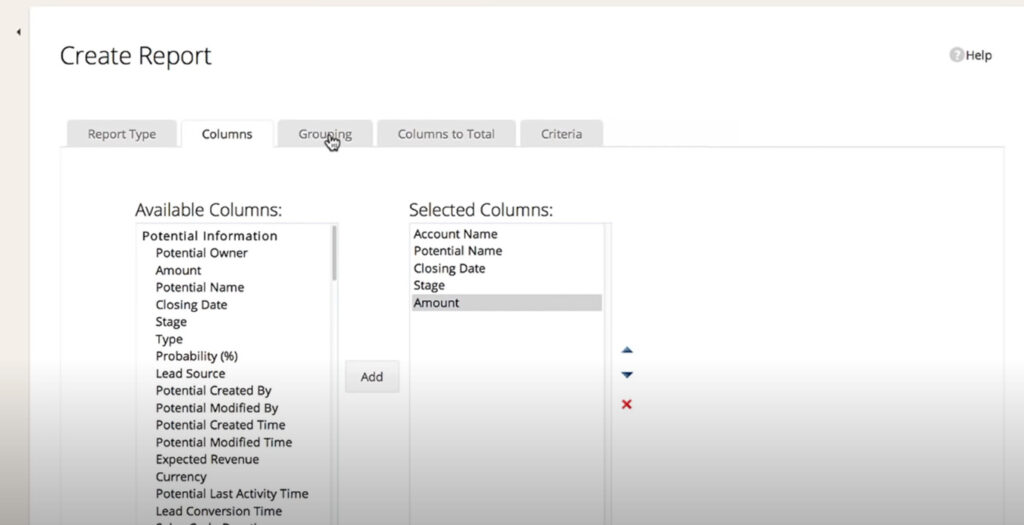
Now, select the Columns which you want to Add to the report. The order of the report is important.
Select Grouping, which is only available in Summary and Matrix Reports. Here, we have grouped the columns by potential stage:
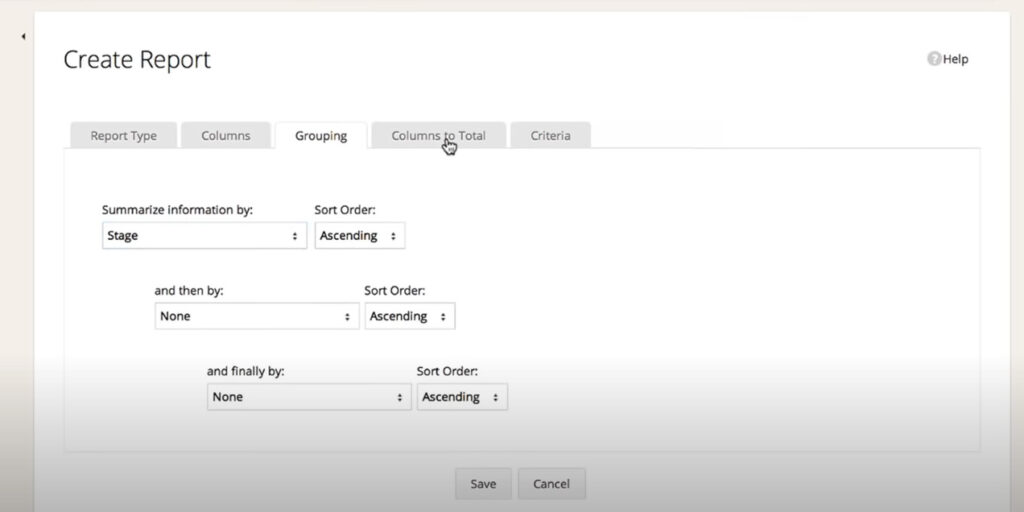
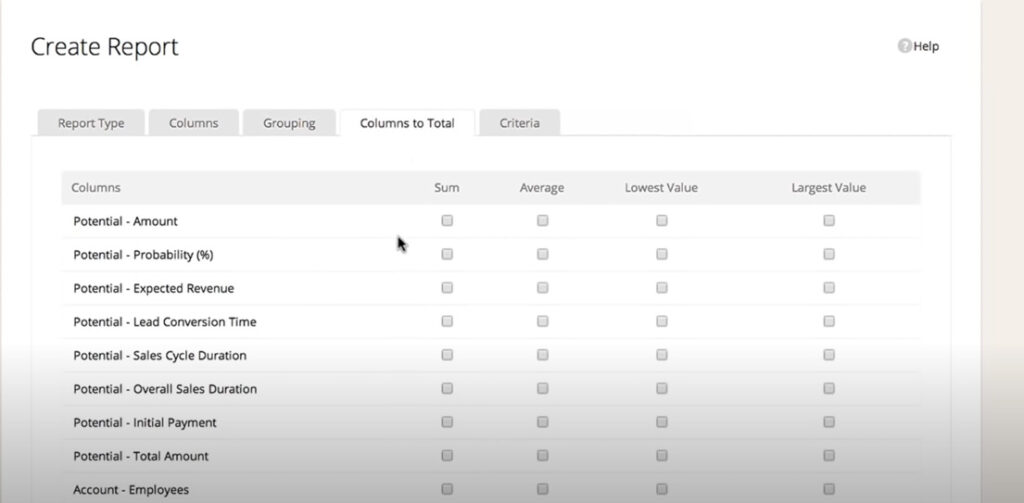
Now, Select Columns to Total, which pulls all the numerical fields of the module on which you can run the report. Here, we will run the report on Sum.
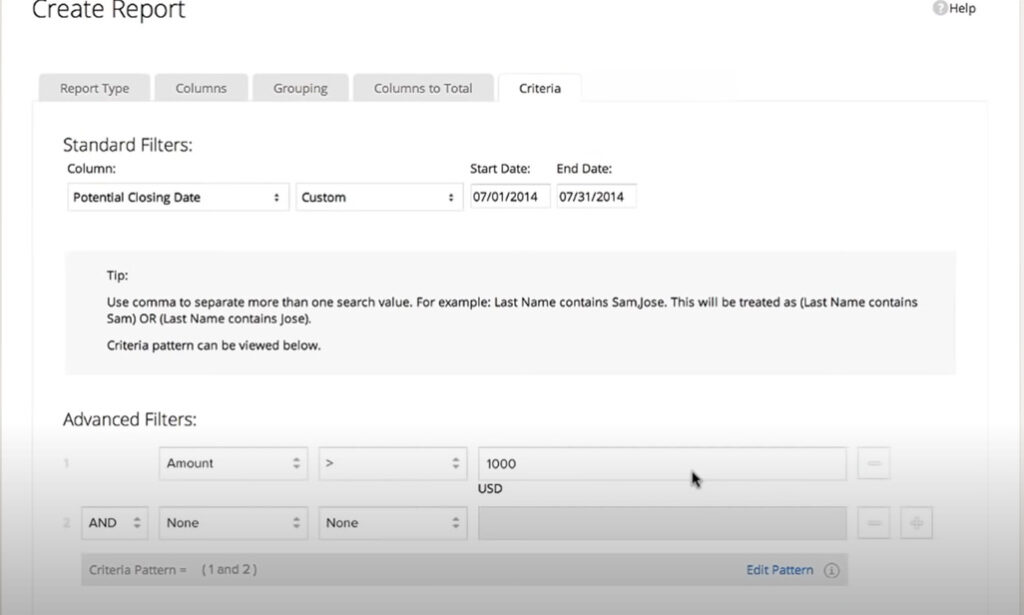
Select the Criteria which you want to display your Report as Shown Below:
Finally, Save the report and name the report as per your liking.
Your Report is done and displayed as a bar graph and a spreadsheet.

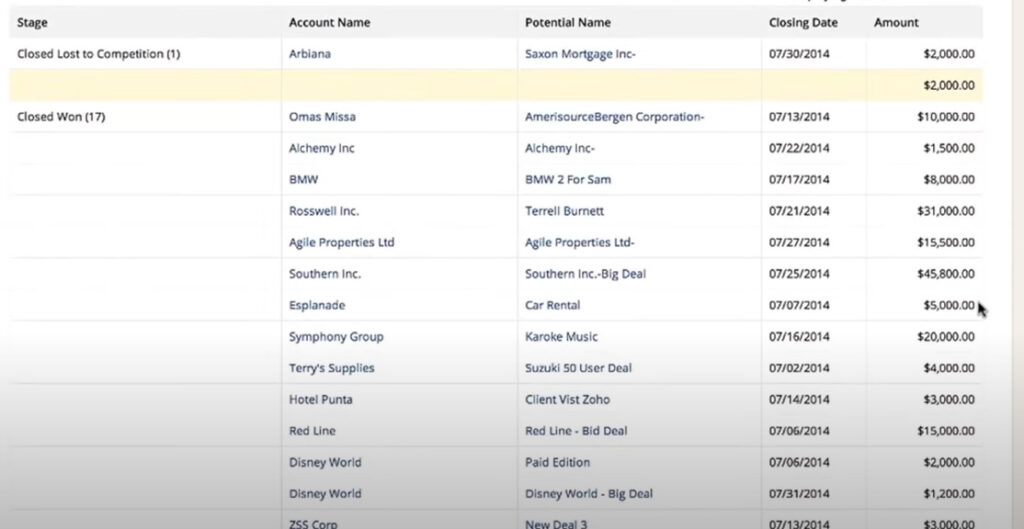
From the bar graph and the spreadsheet, you get a lot of information that you can use to make informed decisions.


